


.webp)
Most enterprise talent acquisition (TA) teams already track 10-15 recruiting metrics, like time-to-fill, cost-per-hire, and conversion rates. The instinct is always to add more metrics.
However, the deeper issue is that the metrics most teams track were built for a model of recruiting that no longer matches how hiring actually works.
Hiring used to be a sequence of requisitions executed by human recruiters reporting to one applicant tracking system, but today it is a continuous pipeline with multiple workers, data sources, and feedback loops, with digital workers and human recruiters working in a shared environment.
Metrics built for the old model cannot describe, govern, or improve the new one. In this blog, we will examine what traditional recruiting metrics still get right, where they break against modern hiring, and the twelve metrics that actually matter.
What Traditional Recruiting Metrics Get Right
The standard recruiting metrics, like time-to-fill, cost-per-hire, and conversion rate, gave hiring teams a common way to compare performance across teams, and accountability that the rest of the business could see on a dashboard.
However, the work they were built to measure has changed ever since. The job now is to figure out where they still hold and where the function needs more
1. Standardizing How Hiring Performance Is Measured Across Roles And Teams
Before time-to-fill and cost-per-hire became standard, recruiting performance was anecdotal. One team would describe a fast hire, and another team would describe a quality hire, and there was no shared way to compare them.
Senior leaders had no method to evaluate one recruiter against another, one quarter against another, or one business unit's hiring against another's. Performance reviews relied on impressions, and budget conversations relied on stories.
Traditional metrics gave the function a shared baseline. Time-to-fill, cost-per-hire, and conversion rate became the core metrics every TA team tracked. Roles and teams could be measured against each other. Quarter-over-quarter comparisons became possible without rebuilding the measurement framework each time.
The consistency allowed recruiting to move out of HR back-office reporting and into business operating reviews. CFOs could compare cost-per-hire to other operating costs, and COOs could compare time-to-fill to operational cycle times in other functions.
Recruiting started to fit into the same discipline that the rest of the business already used because, without that shared metric, TA could not have moved into business reporting at all.
2. Creating Baseline Visibility Into Speed, Cost, And Conversion
Time-to-fill, cost-per-hire, and conversion rate together gave leaders a baseline view of three operational dimensions:
- How fast has hiring moved
- What it costs, and
- How candidates moved through the funnel.
Each one was simple enough to calculate, concrete enough to defend in front of a chief financial officer (CFO), and connected to a strategic lever the team could pull.
- Time-to-fill exposed cycle time, and when it drifted up, the team could investigate whether sourcing slowed, screening backed up, or interview scheduling stretched.
- Cost-per-hire exposed the efficiency of investment, and when it climbed, leaders could compare sourcing channel performance, evaluate vendor contracts, or audit recruiter productivity.
- Conversion rate exposed funnel health. When applicant-to-interview ratios collapsed at a stage, the team knew exactly where the leak sat.
Decisions were made against those numbers. Recruiter assignments shifted toward roles where conversion was strongest, while sourcing budgets moved between channels based on cost-per-hire performance.
The baseline metrics allowed the function to act on data instead of opinion, which was the contribution that earned these metrics their place in every dashboard for the last two decades.
3. Enabling Backward-Looking Reporting For Operational Accountability
Backward-looking metrics are not wrong on their own terms because they are the foundation of operational accountability. Quarterly business reports, board updates, and CFO conversations all run on what already happened, with what variance, against what target.
The recruiting function has to be able to answer those questions, or it does not get a seat at the operating review.
Cost-per-hire and time-to-fill answered the questions well. For example, quarterly variance reports could explain why hiring spend ran above plan, why a particular function missed its time-to-fill target, and why a sourcing investment paid back faster than expected.
Recruiting leaders could justify the headcount allocated to the function, the technology stack the function ran on, and the vendor contracts the function held.
4. Supporting Requisition-Level Tracking And Process Control
The requisition was the unit of work in traditional hiring. A role opens, the team executes against it, the role closes, and metrics align to that model with precision.
- Time-to-fill measures the requisition lifecycle.
- Conversion rates measure movement through stages tied to the requisition.
- Cost-per-hire allocated spend to the requisition that produces the hire.
The alignment made the metrics legible at every level of the team. Every recruiter could see their open requisitions, the metrics attached to each one, and the operational levers available to influence them.
Recruiting managers could roll those views up across their team and identify where individual coaching was needed. TA leaders could roll up further and identify where systemic intervention was needed.
For a function that operated at requisition speed and human-recruiter scale, that level of process control was sufficient because the model produced repeatable results inside its operating environment. The breakdown only became visible when it changed.
Traditional Recruitment Metrics: Misalignment With Modern Hiring Processes
The same metrics that gave recruiting its operational standards are now obscuring what actually moves hiring outcomes. The model of work has changed, and hiring is no longer a sequence of requisitions executed by human recruiters reporting to one system.
It is a continuous pipeline with multiple workers, data sources, touchpoints, and feedback loops, and the metrics that describe it have not kept pace.
Six structural mismatches show up consistently across enterprise recruiting teams running on the standard metrics:
1. Metrics Are Built For Requisition-Based Hiring, While Modern Hiring Operates As A Continuous Pipeline
Traditional metrics assume the requisition is the entry point.
- Time-to-fill begins when the requisition opens.
- Cost-per-hire allocates against the requisition that produced the hire.
- Conversion rates run inside the requisition's stages.
The requisition is the measurement unit, and everything outside the requisition is invisible to the metric.
Modern hiring does not start at the requisition. Talent pools exist before the role opens, sometimes for years. Pre-engagement campaigns run continuously, independent of any specific requisition.
Silver medalists from prior processes, alumni who left and may return, internal mobility candidates considering a move, contractors who could convert to full-time, and external talent in nurture sequences all carry hiring potential before any new opening exists.
The result is a metric set that captures only the requisition phase of a process that mostly happens elsewhere. A team with strong pipeline coverage and a team with no pipeline coverage can produce identical time-to-fill numbers, because the metric measures only what happens after the requisition opens.
The work that actually drives the outcome stays invisible. The recruiter who spent six months nurturing a passive candidate who eventually converted produced a fast time-to-fill metric attributed to the post-opening process.
The recruiter who started cold the day the requisition opened and got lucky also produced a fast time-to-fill. The metric celebrates both equally and reinforces neither behavior intentionally.
2. No Differentiation Between Human Execution And Digital Worker Contribution
Traditional metrics assume every hour of recruiting work is a recruiter's hour. The cost-per-hire formula loads the recruiter's salary into the numerator, and time-to-fill assumes a recruiter is moving the candidate through stages.
Digital workers do not show up in any of these equations. For example, a recruiter screening 50 applications a week and a digital worker screening 5,000 produce different output volumes, and the metric set treats both the same.
According to the 2026 Deloitte State of AI in the Enterprise: The Untapped Edge report, workforce access to AI tools expanded by 50% in a single year, from under 40% of workers to roughly 60% now equipped with sanctioned AI tools.
A hiring function that runs partly on digital labor needs metrics that distinguish what human recruiters did from what digital workers did, what each contributed, and how each performed against role-specific KPIs.
Asymbl Digital Recruiter operates as a defined digital worker on the Asymbl platform, with a job description, performance metrics, escalation logic, and an accountable manager from the day it goes live.
Its contribution to every screening, scheduling, and outreach event is recorded in the same data model as the human team's contribution, which is what allows the metric set to describe a hybrid function accurately rather than reporting only the human portion of the work.
3. Metrics Remain Backward-Looking, While Hiring Now Requires Forecastable Capacity Like Sales And Marketing
Sales and marketing functions moved to forecastable models years ago. Pipeline coverage, predicted close rates, marketing-qualified-lead-to-pipeline conversion, and capacity planning are how these functions justify themselves to the business. Recruiting still runs on backward-looking reporting in most enterprise environments.
The cost of that gap is escalating. Hiring volume, role mix, and timing now sit in finance plans alongside revenue and pipeline. Business leaders are asking the same forward-looking questions they ask sales:
- Can the function deliver against the headcount plan?
- When?
- With what confidence?
- At what cost?
The metrics built for the old model cannot answer any of those questions, because they describe what already happened, but not what the system is capable of producing.
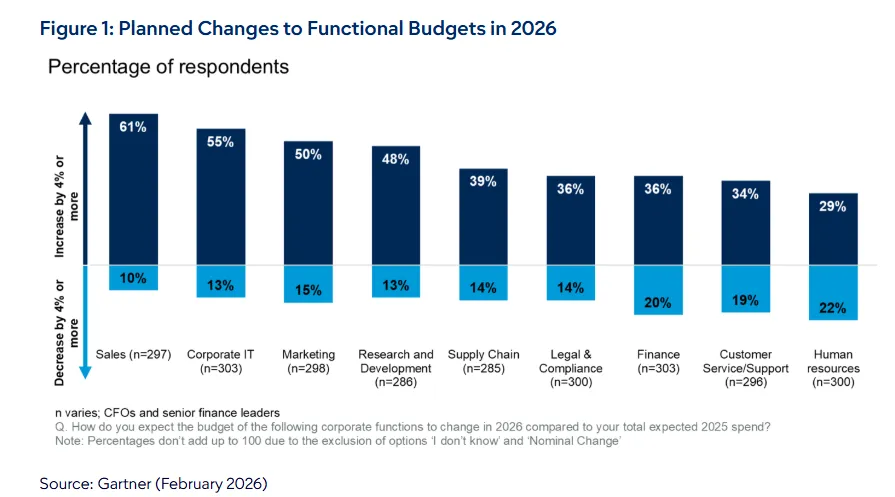
According to a 2026 Gartner survey on AI and technology budget trends, only 29% of CFOs are planning HR budget increases for 2026, while 22% expect cuts, with AI absorbing the capacity work that would otherwise require headcount.
Inside that constraint, the function that cannot forecast capacity loses the budget conversation by default. The CFO is not going to fund a function that cannot describe what it will produce next quarter.
4. Measurement Resets At Each Requisition, Breaking Longitudinal Candidate Insight
Most recruiting metrics are scoped to the requisition. The requisition closes, the metrics archive, and the data attached to that hire move into a closed historical record.
The candidates connected to the closed requisition do not behave the same way. A silver medalist who lost a role to a marginally better candidate is often the right fit for an adjacent requisition.
Their interview history, prior assessment results, hiring manager debriefs, and engagement data are all relevant to the new evaluation.
The traditional metric structure does not carry that signal forward. Each new requisition starts the measurement clock at zero, with no memory of what the function already knows about the candidate it is evaluating.
The recruiter spends time recreating the context that the function generated and then discarded. The hiring manager evaluates a candidate, the function has already been evaluated, often weeks of work, with no efficiency gain from the prior cycle.
The result is institutional amnesia priced into the metric design. Teams pay for the same insight twice, once when they generate it and once when they recreate it for the next role.
5. Metrics Track Process Activity, Not Pipeline Readiness Or Talent Availability
Process metrics describe what the team is doing, but pipeline metrics describe what the team can produce. The standard recruiting metric set is heavily weighted toward the first.
Time-to-fill, conversion rates, and cost-per-hire measure process activity. None of them describes whether the function has enough qualified, engaged talent ready to fill the next 90 days of expected requisitions.
A recruiting team with strong process metrics and a thin pipeline will look healthy until the requisitions hit, and the pipeline cannot supply them.
Time-to-fill will hold for the first few requisitions, then collapse as the function exhausts its warm contacts and starts cold sourcing. Cost-per-hire will spike because cold sourcing is expensive, and conversion rate will drop because cold candidates do not convert at warm-pipeline rates.
Pipeline readiness is the leading indicator that the standard metric set leaves out, and it is the indicator that would have warned the team six months earlier.
6. Data Is Fragmented Across Systems, Preventing End-To-End Signal Continuity
Even if a talent acquisition team wants to track modern metrics, the data architecture often will not support it.
Candidate data lives across the applicant tracking system (ATS), the candidate relationship management (CRM) system, the human resources information system (HRIS), engagement tools, sourcing platforms, interview management tools, and operations spreadsheets that nobody fully maintains.
Each stage of the candidate journey is recorded somewhere, and no single record reflects the full picture.
The metrics inherit the fragmentation.
- Conversion rate calculations exclude what happened outside the ATS.
- Cost-per-hire excludes engagement campaign spend that lives in the CRM.
Every metric tells a partial story because the data underneath it is partial, and the fragmentation is structural.
It came from buying point solutions over time, each one optimized for its own stage of the funnel, none of them designed to share signal with the others. Integrations were built to move records between systems, but the signal did not travel cleanly.
Until the data foundation is unified, modern metrics cannot be calculated reliably. The metric set is downstream of the architecture problem. Investing in better metrics without investing in the data foundation produces dashboards that look modern and report numbers that are wrong.
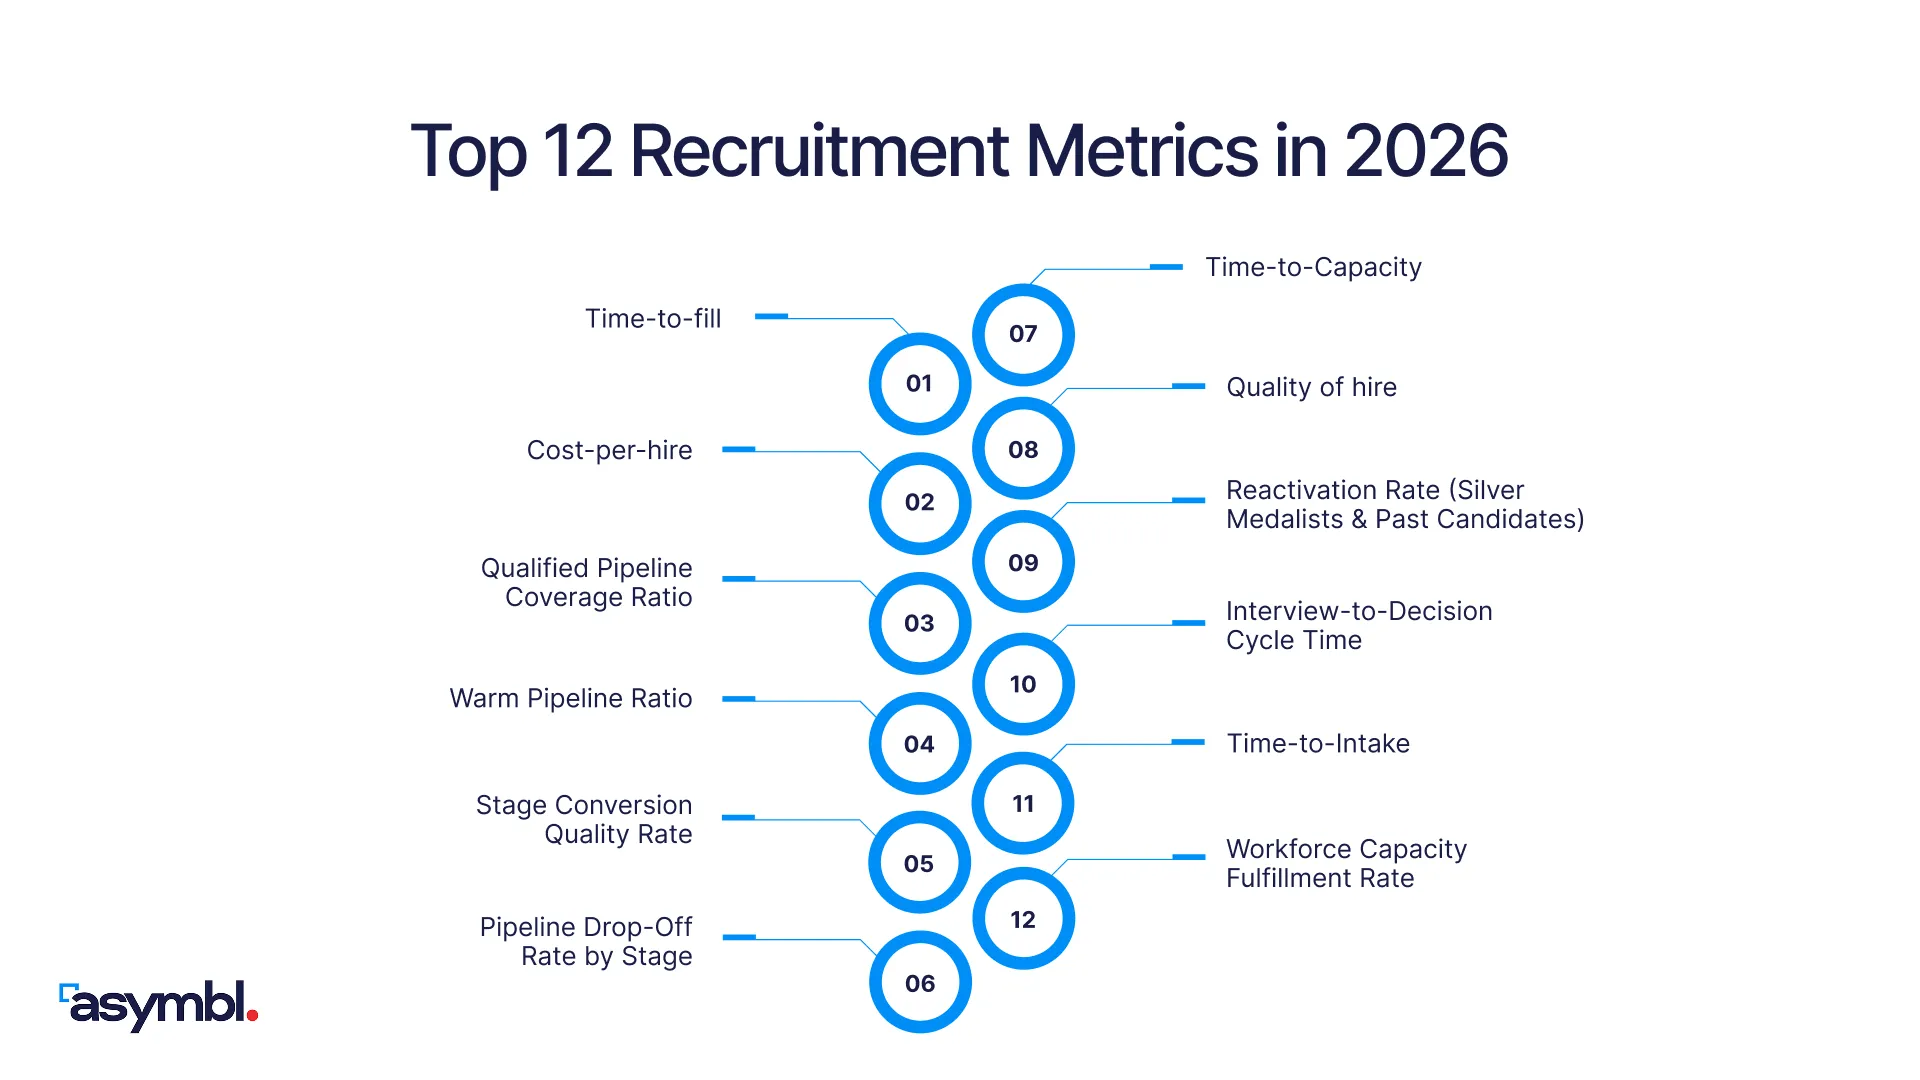
Top 12 Recruitment Metrics In 2026
The twelve metrics below cover the full lifecycle of modern hiring. Some are familiar, refined for what they actually need to capture, while others are new categories that the standard set does not include.
1. Time-To-Fill
The number of days from when a requisition opens to when a candidate accepts the offer.
- Formula:(Date of acceptance) − (Date requisition opens), averaged across requisitions in the period.
- Benchmark: Industry average is 36 to 44 days. Top performers reach 28 days. Technical roles average 50 to 60 days, administrative roles 20 to 30, and executive searches often extend beyond 90.
Why It Matters:
Time-to-fill is the speed metric, useful as one input into capacity and limited on its own. The number describes how fast the function moved through a requisition, but it does not describe whether the speed came from a healthy pipeline or a desperate scramble.
A 30-day fill against a deep, warm pipeline is a sign of a healthy function, whereas a 30-day fill produced by lowering the screening bar to push a marginal candidate through is a sign of a function compromising quality to hit the metric.
The right way to interpret time-to-fill is alongside pipeline readiness and quality of hire. The trio together produces a complete picture of the function's hiring economics.
2. Cost-Per-Hire
The total internal and external cost to produce one hire.
- Formula: (Internal recruiting costs + External recruiting costs) ÷ Number of hires in the period.
- Benchmark: Industry average is approximately $4,425 to $4,700 per hire, with significant variation by seniority, industry, and geography. Executive hires often run 5 to 10 times the average.
Why It Matters:
Cost-per-hire is straightforward to calculate and easy to defend in front of finance.
The risk is that it can be optimized in ways that damage the function. A team that cuts cost-per-hire by reducing sourcing investment, pulling out of expensive channels, or rushing screening to compress recruiter time will report a better number while producing weaker hires.
Cost-per-hire has to be paired with quality of hire, time-to-capacity, and 12-month retention to be meaningful. A cheap hire that underperforms or leaves within a year is significantly more expensive than the metric reports, because the cost of replacement, ramp loss, and quality degradation is borne downstream, where the metric does not see it.
3. Qualified Pipeline Coverage Ratio
The number of qualified candidates available for upcoming requisitions, expressed as a multiple of forecasted demand.
- Formula: Qualified candidates in pipeline ÷ Forecasted requisition demand for the period.
- Benchmark: Mature pipeline-led functions target 3:1 to 5:1 coverage against next-quarter demand. Below 1:1 means the function is operating reactively.
Why It Matters:
Pipeline coverage exposes whether the function can supply the business or will scramble to. A 4:1 coverage ratio means the function can absorb a 25% surge in demand without changing its operating model. A 1:1 ratio means a 25% surge will break the function.
The metric also reveals the concentration of pipeline depth across job families. A 3:1 average ratio that hides a 0.5:1 ratio in engineering and a 6:1 ratio in administrative roles tells the function exactly where to invest sourcing and engagement effort.
4. Warm Pipeline Ratio
The percentage of hires sourced from pre-engaged talent rather than cold inbound applicants.
- Formula: Hires from warm pipeline ÷ Total hires in the period.
- Benchmark: High-performing TA functions target 40 to 60% warm-sourced hires. Below 20% indicates the function is operating reactively against inbound flow.
Why It Matters:
Warm pipeline hires close faster, accept at higher rates, and convert better post-hire. The ratio measures whether sourcing is building a relationship asset or chasing applications.
A function with a 50% warm pipeline ratio has a flywheel, where each hire reinforces the function's reputation in the relevant talent community, which feeds the next round of warm engagement.
A function with a low warm pipeline ratio is rebuilding the funnel from scratch each cycle. Cold sourcing is expensive, slow, and produces lower-quality hires on average, because the candidate has no prior relationship with the firm and no context for the role.
5. Stage Conversion Quality Rate
The proportion of candidates progressing through each stage who meet defined quality thresholds.
- Formula: Candidates progressing who meet quality criteria ÷ Total candidates progressing.
- Benchmark: Target 70% or higher at each stage. Below 50% suggests that upstream qualification is too loose or that downstream criteria are too narrow.
Why It Matters:
Conversion rate alone says how many candidates moved forward in the pipeline, whereas conversion quality rate says how many should have. The combination identifies where pipeline integrity breaks.
A high conversion rate paired with a low conversion quality rate means the team is pushing volume through the funnel without meaningful screening. A low conversion rate paired with a high conversion quality rate means the team is filtering rigorously, but possibly losing candidates who would have been strong fits.
6. Pipeline Drop-Off Rate By Stage
The percentage of candidates who self-disengage at each stage of the process, distinct from candidates intentionally rejected.
- Formula: Candidates who self-exit at stage ÷ Total candidates entering stage.
- Benchmark: 30 to 50% drop-off between application and screening, 10 to 20% between screening and interview, 5 to 10% between interview and offer is common. The above benchmark indicates experience or speed problems.
Why It Matters:
Drop-off targets the stage where the funnel is leaking, not just where it slows. A drop-off spike between application and screening usually traces back to slow response time or unclear next steps.
The metric is most useful when paired with candidate feedback at the point of drop-off. Functions that combine drop-off rate with structured exit signals from candidates who self-exited can target the specific cause and fix it.
Functions that track drop-off without context know where the leak is but not why, which limits the corrective action.
7. Time-To-Capacity
The number of days from offer acceptance to the new hire reaching full productive capacity in the role.
- Formula: (Date hire reaches productive capacity) − (Date of onboarding).
- Benchmark: Knowledge worker roles average 90 to 120 days to capacity. Technical and senior roles often extend to 180 days or more. Sales roles vary widely based on cycle length.
Why It Matters:
The metric reframes the hiring goal from filling the role to producing capacity. A fast hire that takes nine months to ramp delivered nothing in the period the business needed it. The function that optimized for time-to-fill but ignored time-to-capacity celebrated a metric that did not produce the operational outcome.
Time-to-capacity also surfaces the relationship between hiring decisions and onboarding investment. For example, a hire who could have ramped in 60 days but took 120 because onboarding was inconsistent is a measurable cost the metric makes visible.
8. Quality Of Hire
A composite measure of how well new hires perform and how long they stay.
- Formula: A weighted composite, typically (90-day manager satisfaction × weight) + (12-month performance rating × weight) + (12-month retention × weight). Weights vary by organization.
- Benchmark: No single industry numerical benchmark exists, because each organization defines its composite.
Why It Matters:
The most strategically important metric and the hardest to measure, because the data spans recruiting and HR systems. A function that tracks quality of hire rigorously is doing the hardest data integration work in talent acquisition.
The recruiting platform has to know what happened in the HR platform, the performance management tool, and the retention reporting.
The data has to flow back continuously to influence future sourcing and screening, where quality of hire is tracked rigorously, it forces the recruiting and HR data to connect. The composite score also creates a feedback loop that the standard metric set lacks.
For example, sourcing channels that produce high-quality hires get more investment. Interview rubrics that predict performance get more weight, and hiring managers whose hires perform well get more autonomy.
The metric is downstream of every decision the function makes, which is why it is the metric the function should treat as the north star and the metric most functions report on irregularly, because the data is hard to assemble.
9. Reactivation Rate (Silver Medalists & Past Candidates)
The percentage of hires sourced from candidates who were previously in the pipeline for a different role.
- Formula: Hires from prior pipeline candidates ÷ Total hires in the period.
- Benchmark. Best-in-class functions reactivate 15 to 25% of hires. Below 5% indicates pipeline data is not retained or is not used.
Why It Matters:
The metric measures whether the organization is building institutional memory or paying to acquire candidates twice.
For example, a function with a high reactivation rate is compounding its prior recruiting investment. Every hire generates context, relationships, and assessment data that flows back into the next hire.
A function with a low reactivation rate is starting fresh on every requisition, paying full sourcing cost each time.
Reactivation rate also exposes whether the data architecture supports it. Functions with fragmented data cannot find their silver medalists efficiently. The candidates exist in the system, but the search to surface them takes long enough that recruiters skip the step.
Asymbl Talent Intelligence is a reasoning layer that makes reactivation a default behavior rather than an effort. It scores candidates against jobs and jobs against candidate profiles using AI fit analysis, surfaces top talent across available, in-contact, and prior placement pools, and returns a structured breakdown of why a candidate fits a role.
With Talent Intelligence, the function stops paying to acquire candidates twice because the prior pipeline is searchable in seconds rather than archived behind a closed requisition.
10. Interview-To-Decision Cycle Time
The number of days from the final interview completion to a hire or no-hire decision.
- Formula: (Decision date) − (Final interview date), averaged across requisitions.
- Benchmark: Mature TA functions target 3 to 5 days. Above 7 days correlates with a measurable drop-off in offer acceptance.
Why It Matters:
Isolates the decision delay from the process delay. When the candidate is qualified and the interview is complete, this is the metric that exposes hiring manager bottlenecks that other metrics absorb invisibly.
The metric also predicts offer acceptance behavior. Candidates lose interest, accept competing offers, or change their minds when the decision stretches.
A function tracking this metric tightly, with a 3-day target, sees noticeably higher offer acceptance rates than a function operating at 10 days.
The hiring manager bottleneck is one of the few process delays that recruiting cannot fix unilaterally, which makes it a metric worth surfacing in conversations with the broader business about what talent acquisition needs from hiring partners.
11. Time-To-Intake
The number of days from the requisition request to a fully calibrated intake meeting where role requirements, success criteria, and sourcing strategy are confirmed.
- Formula: (Intake meeting completion date) − (Requisition request date).
- Benchmark: High-performing functions complete intake within 3 to 5 business days of request. Above 10 days delays every downstream stage by the same amount.
Why It Matters:
Time-to-intake is the upstream cost most TA functions never measure. Every day of intake delay extends time-to-fill by the same amount, with no way to recover it later. A function with a 12-day intake delay and a 30-day fill target is actually running a 42-day cycle, and the metric set reports only the 30-day portion.
12. Workforce Capacity Fulfillment Rate
The percentage of planned hiring capacity actually delivered in the period, against the plan committed to the business.
- Formula: Hires delivered against plan ÷ Planned hires for the period.
- Benchmark: Target 90% or higher for predictable functions. Below 75% suggests the function is operating without reliable capacity modeling.
Why It Matters:
The capstone metric of the modern hiring metric set. It measures whether the function delivered what the business planned around.
A 95% fulfillment rate means the business can budget against TA's plan with confidence, while a 60% fulfillment rate means the business stops budgeting against TA's plan and starts hedging, which costs the business in plan inefficiency and costs TA in budget conversations.
The metric also forces upstream rigor. A function tracking capacity fulfillment has to set credible plans, which requires accurate demand forecasts, realistic pipeline assumptions, and honest capacity modeling.
Setting easy plans to inflate fulfillment is visible the moment finance or operations compares the plan to actual business demand. The metric is hard to game over time, which is why it is the right metric to anchor the function's accountability to the business.
Why These Metrics Still Fail Without System Design
Adopting a better set of metrics is not enough because even the right metrics underperform when the system underneath them is not designed for them to drive decisions.
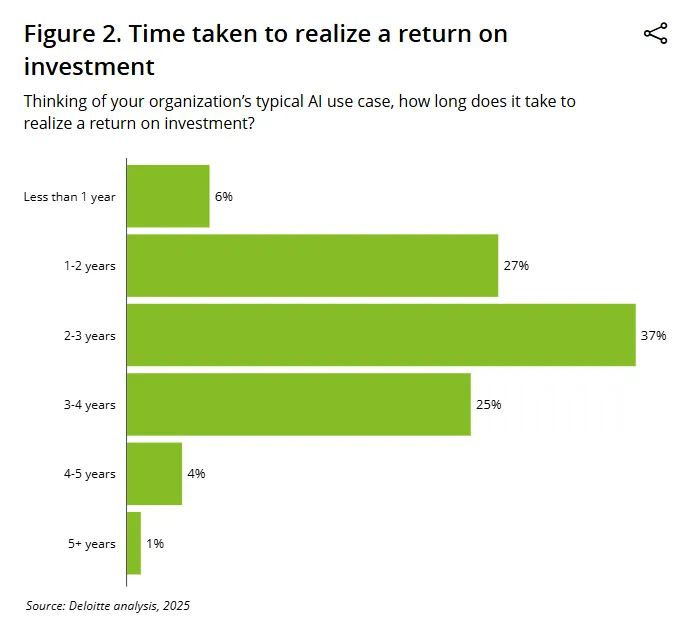
According to the 2025 Deloitte AI ROI Report, only roughly 1 in 5 organizations qualify as AI ROI Leaders despite continued investment, and the gap between metric availability and impact follows the same pattern.
Seven failure patterns show up consistently when modernized metrics get layered onto legacy systems.
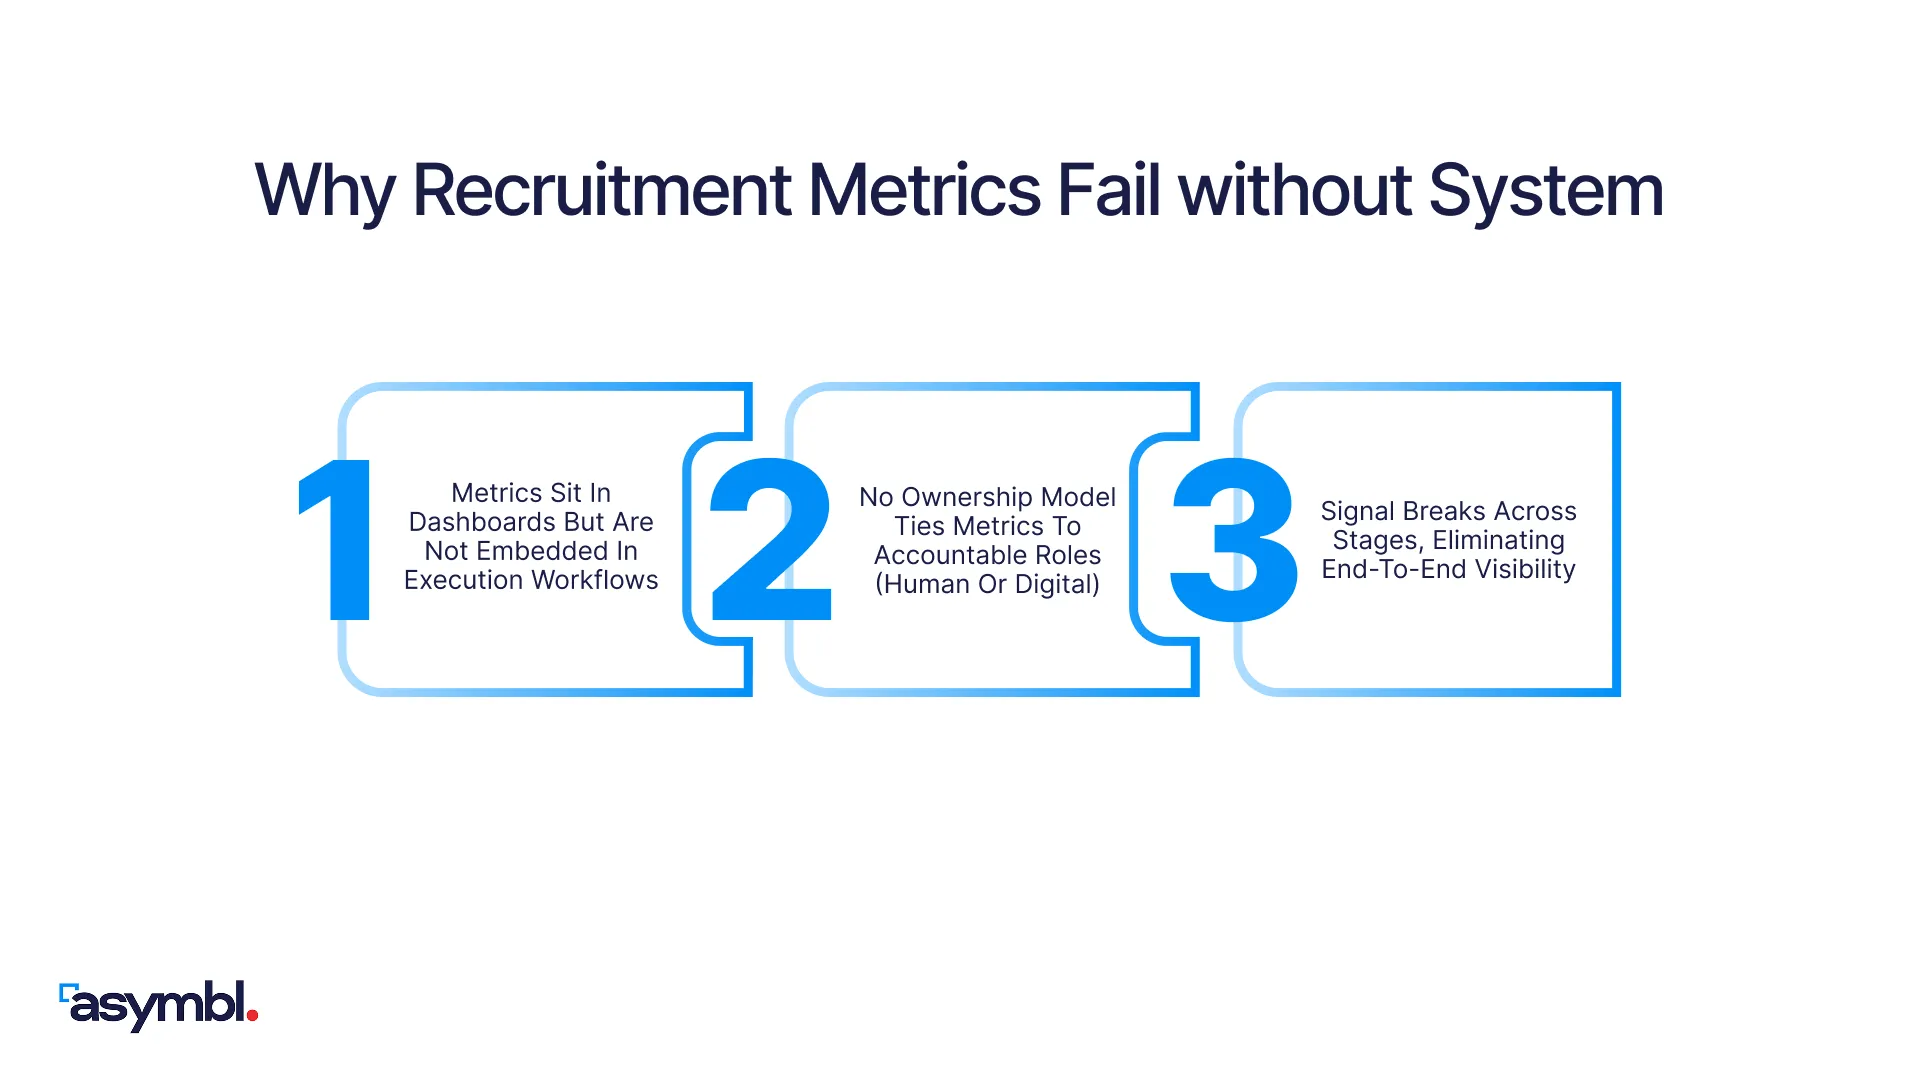
1. Metrics Sit In Dashboards But Are Not Embedded In Execution Workflows
A metric that lives only in a quarterly report does not influence the decision that produced the result.
By the time the dashboard is reviewed, the candidate has already accepted or declined, the hiring manager has already escalated, and the requisition has already missed the target.
For example, when the metrics that drive decisions are embedded where the work happens, the recruiter sees the conversion quality rate inside the candidate record at the moment of evaluation.
Integration converts metric into action, while detachment turns metric into commentary. Most TA dashboards are detached by default, which is why most modernized metric initiatives fail to change function behavior even when the metrics themselves are sound.
2. No Ownership Model Ties Metrics To Accountable Roles (Human Or Digital)
Metrics without owners do not drive behavior. For example, a pipeline coverage ratio that nobody is responsible for stays at whatever level the system happens to produce.
The metric is an observation, and observations don’t produce the change the metric was supposed to drive.
Modern recruiting introduces a second ownership question. Digital workers contribute to outcomes that the metrics measure, like handling:
- Resume screening influences conversion quality rate
- Outreach influences the warm pipeline ratio
- Scheduling influences the interview-to-decision cycle time.
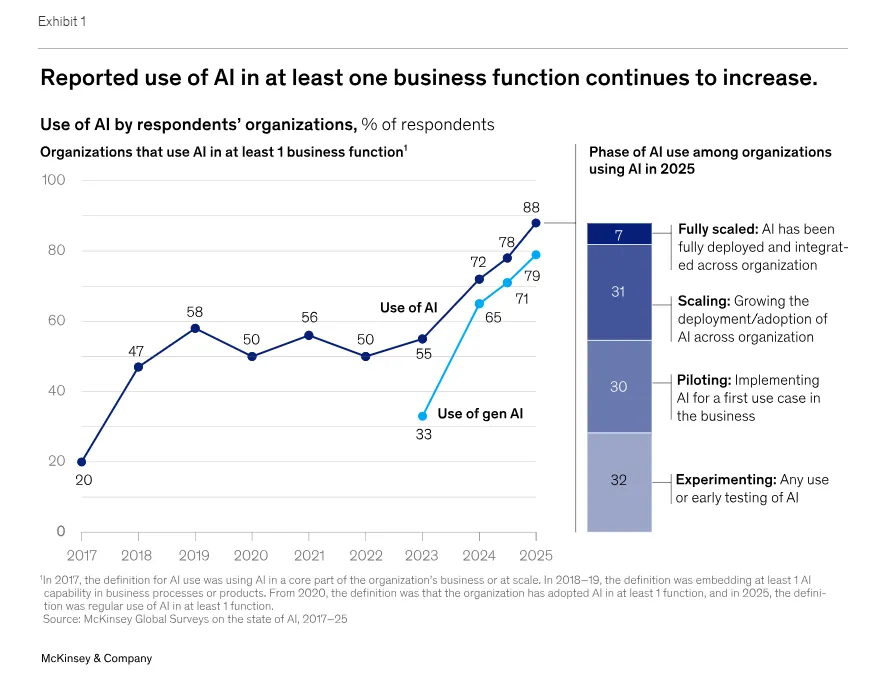
According to McKinsey’s “State of AI in 2025: Agents, Innovation, and Transformation Report,” 88% of organizations report regular AI use in at least one business function, and the same data shows that organizations capturing meaningful enterprise-level value remain a small minority.
Digital workers running without defined responsibilities, performance metrics, and accountable managers produce output that nobody is structured to evaluate or improve.
The right ownership model assigns each metric to a named role with authority to influence the inputs. For example:
- Pipeline coverage might be owned by a Director of Sourcing.
- Conversion quality rate might be owned jointly by a Recruiting Manager and the digital worker handling initial screening.
Each owner has performance management around the metric and the authority to change inputs that move the metric. The metric becomes a managed outcome rather than a reported observation.
Asymbl's Digital Labor Advisory practice runs the Design, Onboard, and Coach framework specifically against this gap. Each digital worker gets a defined role, KPIs, an accountable manager, and a coaching cadence before the worker goes live.
The metric system extends to digital labor by design rather than by retrofit. When a digital worker contributes to a hire, the contribution shows up in the metric set with the same rigor as a human recruiter's contribution.
3. Signal Breaks Across Stages, Eliminating End-To-End Visibility
When the candidate journey crosses systems, the metric loses signal at each crossing. Engagement data lives in the CRM, while application data lives in the ATS. Performance data lives somewhere else, often in a separate performance management system.
Each handoff between systems is a signal degradation event. None of those records connect to each other natively. The connection happens through integrations, custom data syncs, or recruiter-maintained spreadsheets that sit outside the system.
End-to-end metrics like quality of hire and capacity fulfillment depend on signal continuity that the architecture interrupts.
Where Asymbl Fits: From Metrics To Workforce Orchestration
Asymbl runs its own platform internally with rapidly approaching 200 digital workers across 13 business functions, projecting a 56x ROI for the business in 2026.
1. CRM-Native Architecture As The Foundation For Metrics
Asymbl is built on top of Salesforce as a unified data foundation by design. Candidate, requisition, engagement, hire, and post-hire data all live in the same record, so they can be calculated end to end because the data does not break across systems.
There is no ATS-to-CRM sync, no middleware, no parallel data store. The candidate exists once in the system, with every event in the candidate's history attached to the same record.
Engagement campaigns from the marketing function, application records from sourcing, interview outcomes, hire decisions, and post-hire performance all aggregate against the same candidate.
The architecture also supports the connection between recruiting data and the rest of the business. Quality of hire connects to performance management because performance lives in the same Salesforce environment.
2. Aligning Human And Digital Workers Under Shared KPIs
Human recruiters and digital workers on the Asymbl platform operate against shared KPIs. Asymbl Digital Recruiter carries a job description, performance metrics, escalation logic, and a manager from the day it goes live.
The shared KPI structure is what makes hybrid capacity measurable. A 5x output ratio at 1/5 the cost, the actual operating ratio Asymbl runs internally, can only be reported when the human and digital contributions are measured against the same units.
Pipelines, conversions, hires, and capacity fulfillment all aggregate across both labor types in the metric system because the underlying architecture treats both as participants in the same operating model.
3. Making Metrics Actionable Through Orchestration
Asymbl Talent Intelligence is the layer that turns metric signal into action. Pipeline coverage ratios, drop-off patterns, candidate fit signals, and capacity modeling outputs all feed back into the workflows where work is happening.
Talent Intelligence scores candidates against jobs and jobs against candidate profiles using AI fit analysis, and every outcome feeds back into the model. The function gets smarter with every hire, and the metric set gets sharper with every cycle.
Conclusion
The recruiting functions that will lead the next decade are the ones that move beyond reporting and start engineering. They will design metric sets the way production functions design metric sets, with capacity, accountability, and ownership built in from the start.
Three questions to sit with:
- If you removed every recruiting metric you currently track, which ones would you actively rebuild, and which would the function not miss?
- When a digital worker contributes to a hire, where does that contribution show up in your metric system?
- If your CFO asked how many hires the function can deliver next quarter at quality, would your current dashboards answer the question or describe a previous one?
The answers tell you whether your metric set is engineering capacity or reporting on what has already happened.
Asymbl helps enterprise recruiting teams move from metric tracking to workforce orchestration. Book a demo to see how Asymbl can help you with Workforce Orchestration.

Orchestration Was Always the Point. Now It Goes Even Further.
Enterprise AI failures aren't model problems; they're orchestration problems. Discover the 4 layers of AI value and why workforce orchestration is the key to ROI.

The Right Fit Starts With a Conversation.
See what working together could look like.
.webp)